Indicators
Moving Average Indicator (MA)
A moving average (MA) is a stock indicator commonly used in technical analysis, used to help smooth out price data by creating a constantly updated average price. A rising moving average indicates that the security is in an uptrend, while a declining moving average indicates a downtrend.
Exponential Moving Average Indicator (EMA)
What Is an Exponential Moving Average (EMA)? An exponential moving average (EMA) is a type of moving average (MA) that places a greater weight and significance on the most recent data points. The exponential moving average is also referred to as the exponentially weighted moving average.
Moving Average Convergence Divergence (MACD)
Moving Average Convergence Divergence (MACD) is a trend-following momentum indicator that shows the relationship between two moving averages of a security's price. Traders use the MACD to identify when bullish or bearish momentum is high in order to identify entry and exit points for trades.
Relative Strength Index (RSI)
The Relative Strength Index (RSI), developed by J. Welles Wilder, is a momentum oscillator that measures the speed and change of price movements. The RSI oscillates between zero and 100. Traditionally the RSI is considered overbought when above 70 and oversold when below 30.
Percentage Price Oscillator Indicator (PPO)
What Is the Percentage Price Oscillator (PPO)? The percentage price oscillator (PPO) is a technical momentum indicator that shows the relationship between two moving averages in percentage terms. The moving averages are a 26-period and 12-period exponential moving average (EMA).
Parabolic SAR Indicator (SAR)
The parabolic SAR (stop and reverse) indicator is used by technical traders to spot trends and reversals. The indicator utilizes a system of dots superimposed onto a price chart. A reversal occurs when these dots flip, but a reversal signal in the SAR does not necessarily mean a reversal in the price.
Average Directional Index (ADX)
ADX stands for Average Directional Movement Index and can be used to help measure the overall strength of a trend. The ADX indicator is an average of expanding price range values. The ADX is a component of the Directional Movement System developed by Welles Wilder.
Stochastic Oscillator
Stochastic oscillators measure the momentum of an asset's price to determine trends and predict reversals. Stochastic oscillators measure recent prices on a scale of 0 to 100, with measurements above 80 indicating that an asset is overbought and measurements below 20 indicating that it is oversold.
Standard deviation
A standard deviation (or σ) is a measure of how dispersed the data is in relation to the mean. Low standard deviation means data are clustered around the mean, and high standard deviation indicates data are more spread out.
Bollinger Bands
Bollinger bands help determine whether prices are high or low on a relative basis. They are used in pairs, both upper and lower bands and in conjunction with a moving average. Further, the pair of bands is not intended to be used on its own. Use the pair to confirm signals given with other indicators.
Fibonacci retracement
Fibonacci retracement levels are horizontal lines that indicate the possible locations of support and resistance levels. Each level is associated with one of the above ratios or percentages. It shows how much of a prior move the price has retraced. The direction of the previous trend is likely to continue.
Commodity Channel Index (CCI)
The Commodity Channel Index (CCI) measures the current price level relative to an average price level over a given period of time. CCI is relatively high when prices are far above their average. CCI is relatively low when prices are far below their average.
Ichimoku cloud
The Ichimoku Cloud indicator is a technical indicator that tells you everything about the price trends like momentum, direction, volatility, support, resistance, and potential reversals. So this indicator can be termed as an “All in one” indicator.
On-Balance volume (OBV)
Description. On Balance Volume (OBV) measures buying and selling pressure as a cumulative indicator that adds volume on up days and subtracts volume on down days. When the security closes higher than the previous close, all of the day's volume is considered up-volume.
Accumulation/Distribution line
Accumulation Distribution looks at the proximity of closing prices to their highs or lows to determine if accumulation or distribution is occurring in the market. The proximity value is multiplied by volume to give more weight to moves with higher volume.
Aroon Indicator
The Aroon indicator, developed by Tushar Chande, indicates if a price is trending or is in a trading range. It can also reveal the beginning of a new trend, its strength and can help anticipate changes from trading ranges to trends.
Trendlines
Trendlines are easily recognizable lines that traders draw on charts to connect a series of prices together or show some data's best fit. The resulting line is then used to give the trader a good idea of the direction in which an investment's value might move.
Divergence
Divergence is when the price of an asset is moving in the opposite direction of a technical indicator, such as an oscillator, or is moving contrary to other data. Divergence warns that the current price trend may be weakening, and in some cases may lead to the price changing direction.
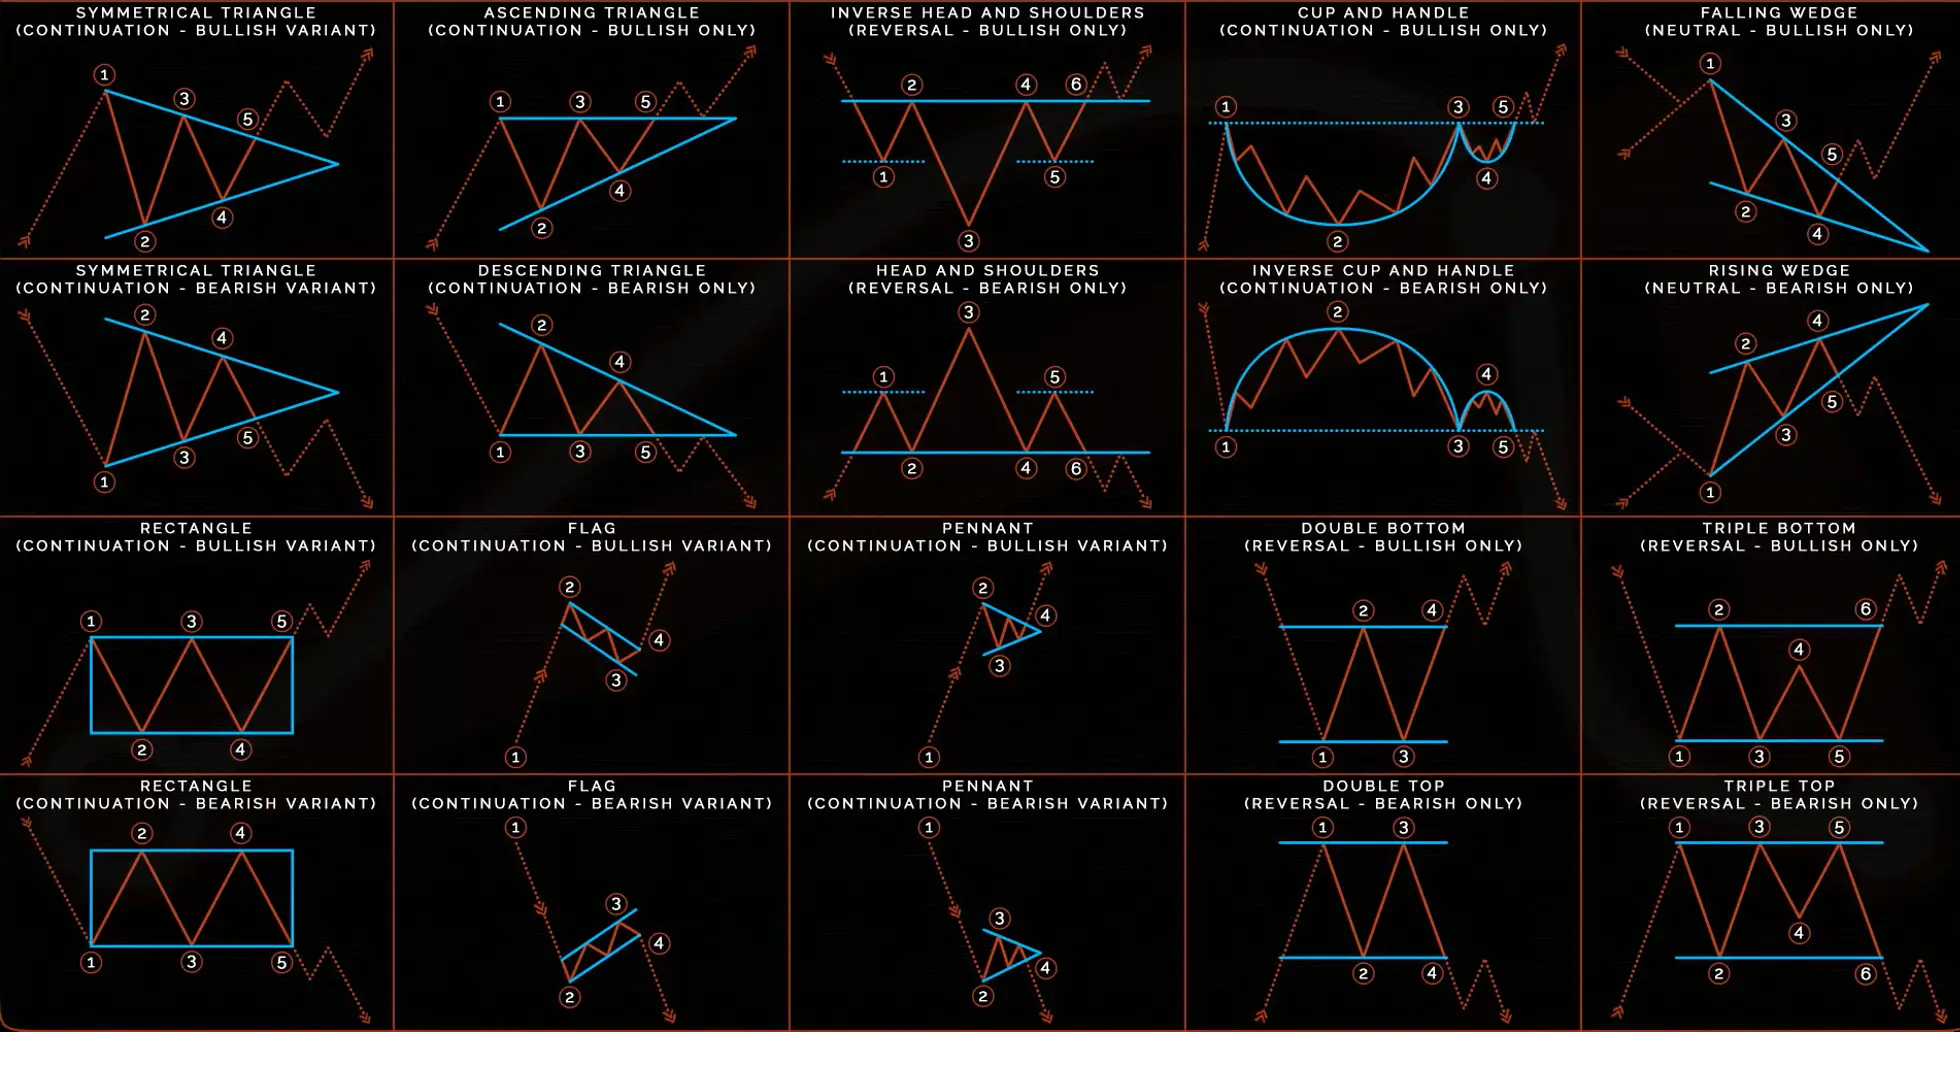
Chart Patterns
Symmetrical Triangle
A symmetrical triangle is a chart pattern characterized by two converging trend lines connecting a series of sequential peaks and troughs. These trend lines should be converging at a roughly equal slope.
Ascending Triangle
An ascending triangle is generally considered to be a continuation pattern, meaning that the pattern is significant if it occurs within an uptrend or downtrend. Once the breakout from the triangle occurs, traders tend to aggressively buy or sell the asset depending on which direction the price broke out.
Descending Triangle
A descending triangle is a bearish chart pattern used in technical analysis that is created by drawing one trend line that connects a series of lower highs and a second horizontal trend line that connects a series of lows.
Head and Shoulders
The left shoulder forms when investors pushing a stock higher temporarily lose enthusiasm. The head forms when enthusiasm peaks and then declines to a point at or near the stock's previous low. The right shoulder forms as the stock price rallies once again but fails to reach its previous high before falling again.
Inverse Head and Shoulders
An inverse head and shoulders pattern forms when the price of an asset falls to a trough, then rises, falls for the second time, but this time the fall is steeper than the first. The price rises again and drops for the final time.
Cup and Handle
What Does a Cup and Handle Pattern Indicate? A cup and handle is a technical indicator where the price movement of a security resembles a “cup” followed by a downward trending price pattern. This drop, or “handle” is meant to signal a buying opportunity to go long on a security.
Inverted Cup and Handle
An 'inverted cup and handle' is a chart pattern that indicates bearish continuation, triggering a sell signal. Think of it as an upside-down cup and handle. If you look at the regular cup and handle pattern, there is a distinct 'u' shape and downward handle, which is followed by a bullish continuation.
Falling Wedge
The falling wedge pattern occurs when the asset's price is moving in an overall bullish trend before the price action corrects lower. Within this pull back, two converging trend lines are drawn. The consolidation part ends when the price action bursts through the upper trend line, or wedge's resistance.
Rising Wedge
A rising wedge is often considered a bearish chart pattern that points to a reversal after a bull trend. A rising wedge is believed to signal an imminent breakout to the downside. Like other wedges, the pattern begins wide towards the bottom and contracts as the price moves higher and the trading range narrows.
Rectangle
A rectangle is a pattern that occurs on price charts. A rectangle is formed when the price reaches the same horizontal support and resistance levels multiple times. The price is confined to moving between the two horizontal levels, creating a rectangle.
Flag
The flag pattern is used to identify the possible continuation of a previous trend from a point at which price has drifted against that same trend. Should the trend resume, the price increase could be rapid, making the timing of a trade advantageous by noticing the flag pattern.
Pennant
Pennants are continuation patterns where a period of consolidation is followed by a breakout used in technical analysis. It's important to look at the volume in a pennant—the period of consolidation should have lower volume and the breakouts should occur on higher volume.
Double Bottom
A double bottom pattern is a classic technical analysis charting formation showing a major change in trend from a prior down move. The double bottom pattern looks like the letter "W." The twice-touched low is.
Double Top
What Is a Double Top? A double top is an extremely bearish technical reversal pattern that forms after an asset reaches a high price two consecutive times with a moderate decline between the two highs. It is confirmed once the asset's price falls below a support level equal to the low between the two prior highs.
Triple Bottom
A triple bottom is a visual pattern that shows the buyers (bulls) taking control of the price action from the sellers (bears). A triple bottom is generally seen as three roughly equal lows bouncing off support followed by the price action breaching resistance.
Triple Top
A triple top is formed by three peaks moving into the same area, with pullbacks in between. A triple top is considered complete, indicating a further price slide, once the price moves below pattern support. A trader exits longs or enters shorts when the triple top completes.
Chart Pattern Cheat Sheet